
I have written repeatedly now about how the math inherent in the Washington Governor’s new so-called reopening plan is flawed—or alternatively is built to purposefully hold the state back longer than necessary.
My full analysis of the plan is in the link below:
None of that has really changed, but I encourage you to read through it if you haven’t already because much of what follows assume you already are familiar with those concepts.
So now I’m left waiting for each new week’s report to come out to see how well I predicted it correctly.
So far, so good (well, good for my analysis. Not good for Washington, really.)
Today’s January 22nd reports are hot off the presses. While I haven’t looked deeply at every district yet, an expected and obvious problem with the “plan” jumped out right away.
If you are in the North Central District you really should not be closed anymore, even according to the Governor’s own questionable logic. But the way he built his plan hides the data and tries to make North Central appear worse than it actually is.
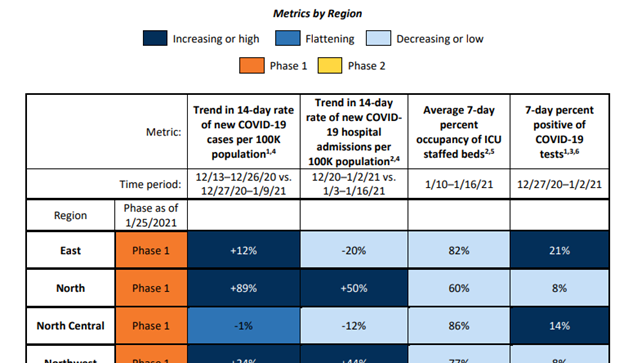
Let’s jump into the numbers, shall we? To start with, here is the report for today:
421-006-RoadmapToRecovery-20210122.pdf (wa.gov)
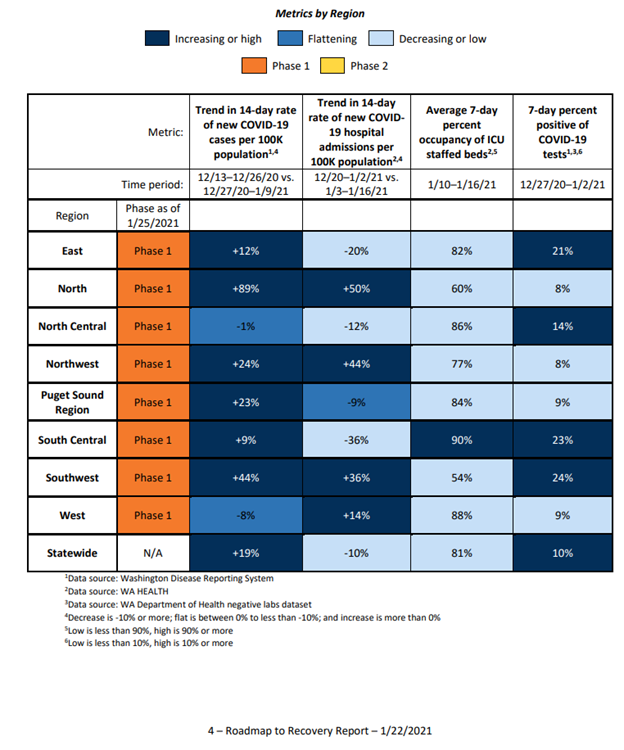
Notice North Central—forever close to the weekly trend metric but never quite there. Here’s the deal—North Central’s numbers only look bad if you look at them on the short-term-memory, weekly reset plan of the Governors. Instead lets look at the actual numbers for North Central.
Here is the table of real numbers for North Central (I cleaned up some columns for legibility.)
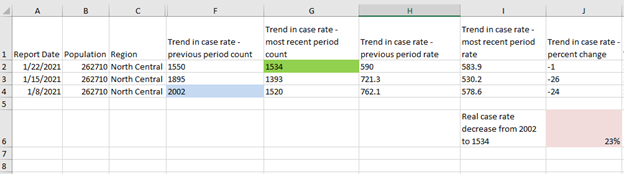
Start by looking in Column J. You’ll see that the -24%, -26%, and -1% correspond to the case-rate trend being used by the plan over the last 3 weeks. -24% and -26% are “good enough” to advance phases, but -1% is not.
BUT, if you look at where they started and where they are now you can see how the Governor’s plan hides the truth. They started at a case-count of 2002 (blue field) and the most recent case-count is 1534 (green field).
That means that over three weeks of counting the case-count/case-rate rate for North Central has dropped 23%. -23% is more than the -10% threshold last I checked.
Now Let’s Look At North Central’s Hospitalization Rate The Same Way
In the January 22nd report, North Central is reported as a -12%, which is good enough, yes, but just barely. What do the real numbers show?
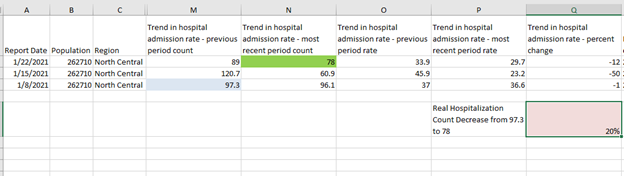
Looking the same way at it, you can see there were ups and downs, but the most recent count is 20% less than when the Roadmap To Reopening plan was announced. Again, -20% exceeds the -10% required threshold.
If you discount those two metrics as obviously problematic, all that is left holding back North Central this week is the 7-day positive percentage rate sitting at 14%:
But there are two problems with that.
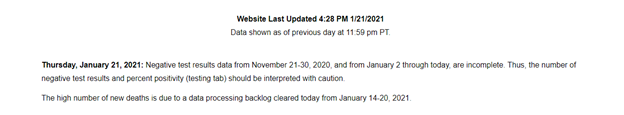
First, the WA Department of Health still (always?) has its disclaimer up that it hasn’t counted all the negative tests (implying that the positive percentage rate is artificially high). They themselves say that the percent positivity number “should be interpreted with caution.”
Second, positive percentage rate is not a good indicator of the current, real state of virus spread in the first place because it relies on comparing how many healthy people without covid still go out and get tested. If we finally get to a point where only people actually sick with covid go get a test, then the positive percentage rate would always be 100%.
What would it have taken to drive that value down the extra 5% needed to be “phase worthy?” Here are the numbers:
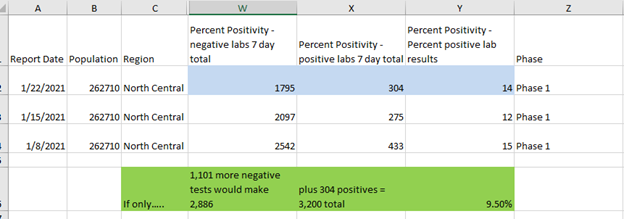
To bring the North Central positive percentage numbers down from 14% to 9.5% they would have needed 1,101 more negative tests between December 27th through January 2nd.
It may be that some or all of those needed 1,101 negative tests are in the yet-uncounted negative tests that the state has a hard time keeping up with. Even if they aren’t, kinda sucks to know that if 1,101 of you in North Central who know that you don’t have covid would have gotten a test taken over the New Year’s holiday time frame, you would have driven this last, outstanding metric down under the threshold.
Now of course it is ridiculous to suggest that as many healthy people as possible go get tested just to drive the positive percentage rate down. But it does demonstrate (yet again) how the Roadmap to Reopening plan hides the real state of the pandemic and purposefully holds back districts that are objectively much improved over where they started.
The only way any district will reopen under this plan is if they somehow get lucky enough for metrics to magically align or if citizens start gaming the system (like flooding the positive percentage metric with known-healthy people getting tests). Those are sure signs that this plan is flawed and that Washington legislature must act immediately to take safe steps to reopen the state.
(Note, it is possible there are other districts that are equally jobbed by today’s report. North Central is the one I anticipated would be the most obvious example so I started there to get the info out ASAP. I’ll continue to dig in to the other districts as well.)