
The Math Shows That Washington’s New “Reopening” Plan Is Doomed Before It Begins (updated Jan 15)
January 15th Update
When it is easy to see something coming you aren’t surprised when the results come in the way you expected. Early in January I predicted that the way the Governor’s new “reopening” metrics were setup, it would be VERY difficult for any district to meet the criteria because of how half of the metrics compare numbers to the week before.
Sure enough, with today’s numbers the whole state stays in Phase 1 (shocker). Here’s the graph with some notes about it below:
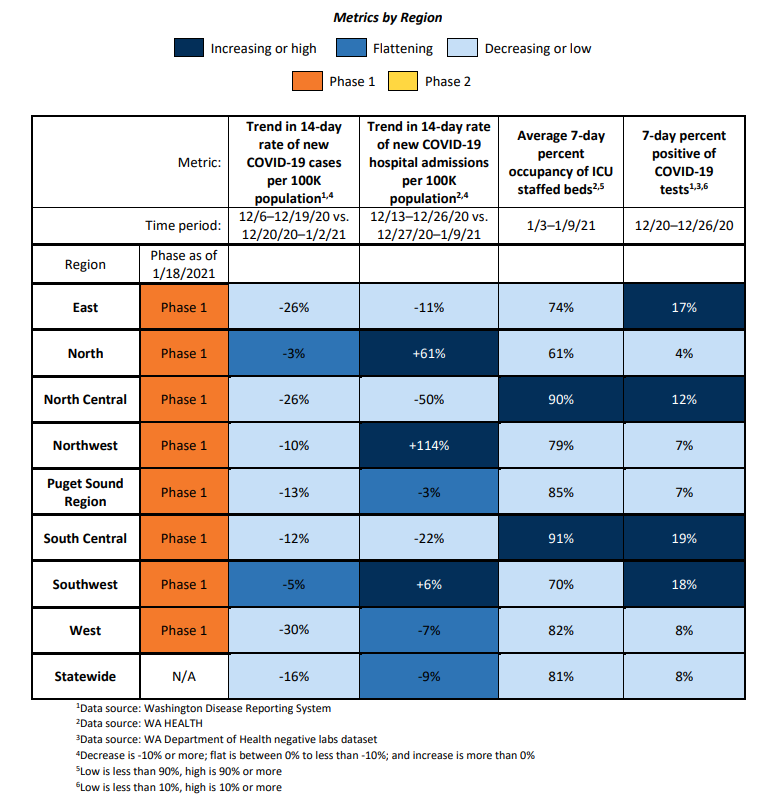
Two Districts *almost* make it, but sorry for you, it isn’t enough. Puget Sound was short an extra 7% drop in the hospitalization rate and West was short a heart-breaking 3% to cross in to Phase 2.
Now here is where the problem occurs that is going to keep us shutdown if the Governor does change this ridiculous plan. Since we didn’t make it this go-round, the gains we made in the case-rate and hospitalization-rate metrics ARE NOT GOING TO COUNT FOR US NEXT WEEK. That is to say, next week’s comparison will be against this week’s lower number, wiping out any chance at slow, steady, cumulative gains to get to Phase 2.
I feel really sad for the districts whose Decreasing/Low categories for those to metrics were really large. There are some 26%, and 30%, and even a 50%. More bad news for you–since you didn’t move to Phase 2 this week, those huge gains you made this week are going to make it even harder for you to move to Phase 2 next week.
This cycle is going to continue. Every District will meet the “criteria” in one or more categories, but not all at once. Since the way they count the metrics in two of the four categories RESET each week and erase any gains made the only way to Phase 2 is for a given district to dramatically reduce all four categories in a single week.
Take the Puget Sound District as an example. Positive gains were made in all 4 categories. In fact, the metric that stopped them from moving to Phase 2 was that hospitalizations “only” went from a +1% to a -3%. But don’t lose sight of the case-rate category. That went from -27% to -13%. That doesn’t mean that Puget Sound is getting worse. It only means it isn’t improving as fast as the week before.
Watch as next week the hospitalization rate grows to over 10%, but the case-rate *improvement* falls to -9% or lower and that stops Puget Sound again.
Short of COVID-19 magically disappearing in a district all in the same week, the Governor’s plan will continue to make no allowance for slow, steady improvement. The way the math works, the more weeks that go by the harder it will be to make the next Phase even if you keep improving each week.
This is a ridiculous “plan” and the only way out of this for any of us is if the Governor changes the way he counts the metrics or if our legislature comes to their collective senses and halts the state-of-emergency.
Original Article From The Week of Jan. 4th Below:
Early in the new year, Governor Jay Inslee announced his 4th or 5th (depending on how you count them) reopening plan for the State of Washington. This one is called “Healthy Washington – The Roadmap To Recovery.” It officially begins on January 11th, 2021, but it’s fundamental flaws are already apparent.
Let us set aside for now some of the other objections to the new “plan.” Like the grouping of counties together so that numbers from heavier population centers hurts a smaller county’s progression. Or the fact that the “plan” only has 2 phases, and the 2nd phase, by any measure, is itself a crippling pile of restrictions for most businesses.
Instead, let’s look at a metric defined into the plan that by itself could mean the state NEVER moves on to any phases.
First, here is the link to the Governor’s plan so you can double-check this for yourself.
https://www.governor.wa.gov/sites/default/files/HealthyWashington.pdf
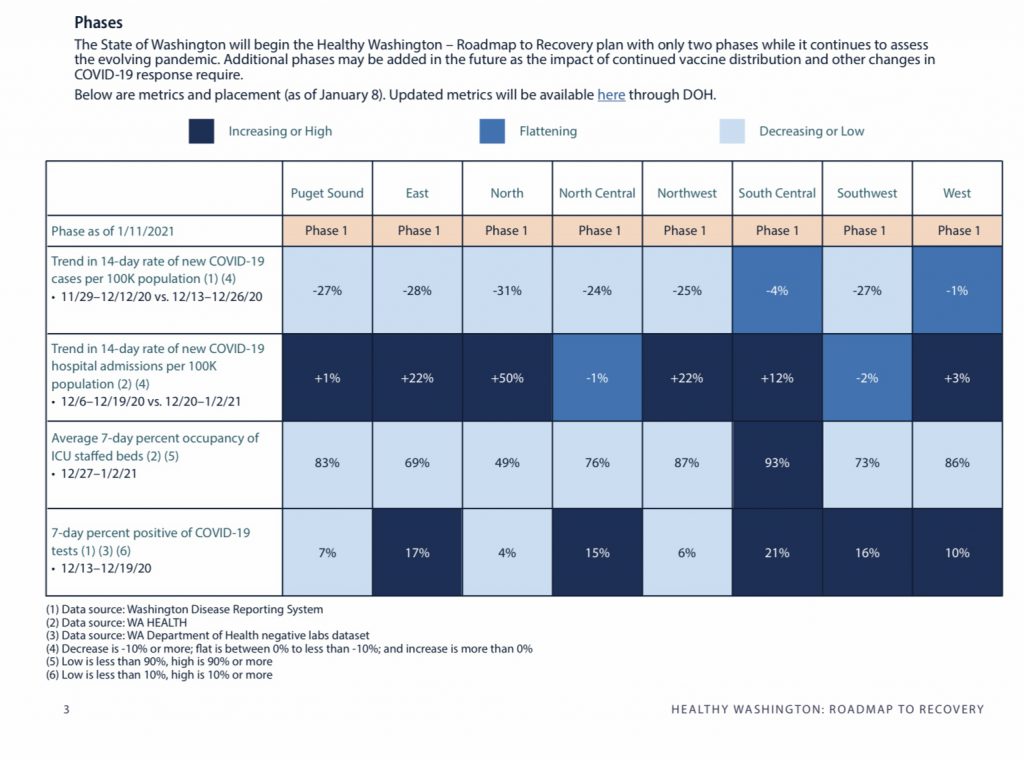
Two out of the four metrics that will be used for a district to advance from Phase 1 to Phase 2 have potential for a scenario where no district ever advances. Those two metrics (from page 2 of the above document) are:
• Decreasing trend in 14-day rate of new COVID-19 cases per 100K population;
• Decreasing trend in 14-day rate of new COVID-19 hospital admissions per 100K population;
Each Friday they will compare those numbers from the last week to the week before. To see the flaw in this logic, look at how they themselves say they will count the case rate (Appendix 1, page 5):
This metric is calculated by dividing the number of cases with a specimen collection date in a 14-day period by the population in the region and multiplying by 100,000. The percent change is calculated by subtracting the rate during the most recent time period from the preceding time period, dividing by the rate in the preceding time period, and multiplying by 100. The direction of the trend is defined by thresholds. The thresholds for this metric are:
• Decrease: -10% or more
• Flat: between 0% to less than -10%
• Increase: More than 0%
In order for a district to advance to Phase 2 the case rate must reduce by 10% or more from the previous week. However, a reduction of less than 10% leaves that district in the same Phase.
But what happens if a district has steady, gradual improvement at the rate of 9% each week?
We end up in a ridiculous state where the case rate is dramatically low, but the “rules” leave us stuck in Phase 1. To see how this works, let’s use some sample numbers.
Since the plan compares each week to the week before and not to a fixed number we could see the case rate slowly but steadily drop to a minuscule number–but if that decrease is only 9% a week, YOUR DISTRICT WILL NEVER ADVANCE.
Let’s say your district starts at a case rate of 200.
Next week, you drop 9% of 200 to 182. Sorry, not enough–stay in Phase 1.
The following week you drop 9% of 182 to 166. Close but no cigar.
Week 3 you drop 9% of 166 to 151. Nice try. Still closed.
Week 4 you drop 9% of 151 to 137. Nope.
Week 5 you drop 9% of 137 to 125. Check again next time.
After 8 weeks of this pattern the case rate would be less than half of where it started, but you still haven’t met the metrics and are still in phase 1. (The week 8 metric would be a case rate of around 94 if you are following along with your calculator.)

It gets even worse if the steady improvement is only 2-3% per week. After 40 weeks of 2% weekly improvement the case rate would be at or near 90, but according to the new plan’s metric the district would not once appear close to enough to meeting the advancement criteria. In fact, such a slow, steady trend downward, since it was only 2% each week, would likely be represented by the Governor on the weekly reports as being a bad indicator. Certainly it wouldn’t allow advancement.
I used case-rates in these examples, but the hospitalization-rate metric has the same fatal flaw because it also uses a week-to-week comparison with a 10% bar.
Can you imagine the frustration if one of those two metrics finally met the 10% bar, but the other metric only made it to 9%?
The only hope under this plan is that somehow multiple metrics make significant improvements all in the same week. This will be even harder when you consider that hospitalizations seem to trail case rates. So a significant improvement in case rates won’t show up until a few weeks later in hospitalization rates–at which point case rates might settle back down to a sub-10% improvement.
Anyone with 3 minutes and a calculator can see that this so-called plan is designed to punish a slow, steady recovery by never allowing a district to advance. It won’t take long to see how these criteria can interact with each other, and we will eventually see the Governor’s office change the metrics and plan yet again.
The criteria in the Governor’s new plan couldn’t have been better designed to keep the state locked down for extended timeframes if it was made that way on purpose.
Perhaps it was.
<<Some clarification based on feedback I’ve received>>
My point in the end is not that I believe the lockdowns will last forever. Rather it is that this version of the plan has factors built-in to it that could result in such a scenario.
What I think will actually happen is that after a few weeks or months of sub-10% improvement across the required categories it will be seen that the target metrics are not obtainable. Then the plan will be changed again to substitute those two week-to-week metrics for something else.
Even in my more pessimistic moments I don’t believe we will stay shut through the next year. I simply don’t believe that the metrics of this new plan the way that they are currently defined are going to allow for it.